Story
In a previous article, we explored the main features of CrowPanel ePaper displays and learned how to use Elecrow libraries to control a 5.79″ panel with Arduino through a simple example.
This time, we will dive deeper into the capabilities of this display by using the GxEPD2 library, a popular Arduino library for controlling ePaper screens, and apply everything we've learned in a concrete project: a real-time Bitcoin price monitor.
The GxEPD2 Library
GxEPD2 is the evolution of GxEPD, the first version of an Arduino library specialized in controlling ePaper displays (EPD - Electronic Paper Display) with an SPI interface. Developed by Jean-Marc Zingg (ZinggJM), GxEPD2 expands the capabilities of its predecessor and provides support for a wide range of displays from leading manufacturers such as Good Display and Waveshare.
The GxEPD2 library relies on another widely-used library, Adafruit_GFX, for its operation. This library, developed by Adafruit, is one of the most popular libraries in the Arduino ecosystem. It provides a set of functions for drawing text and geometric shapes on a variety of displays, such as LCD and OLED screens.
Next, I will explain how to install the GxEPD2 and Adafruit_GFX libraries in Arduino IDE 2 to use them with the 5.79″ Elecrow panel and how to leverage their features to display text, graphics, and images.
In this tutorial, I assume you already have Arduino IDE 2 installed and configured to use the 5.79-inch CrowPanel. If not, I recommend reading my previous article where I explain how to set it up.
Installation
Before using these libraries, you need to install them in the Arduino IDE following the standard procedure.
Since GxEPD2 depends on Adafruit_GFX, you only need to install GxEPD2 directly. During the installation process, the IDE will detect the dependency and prompt you to install the Adafruit library. At that point, simply confirm and proceed with the installation.
The process is the same as for installing any other library. Click on the Library Manager in the left-hand toolbar or select Tools → Manage Libraries from the main menu.
Using either method will open a search box. Type GxEPD2 to search for the library, and when you find it, click the INSTALL button.
In the IDE, you should see something like the following:
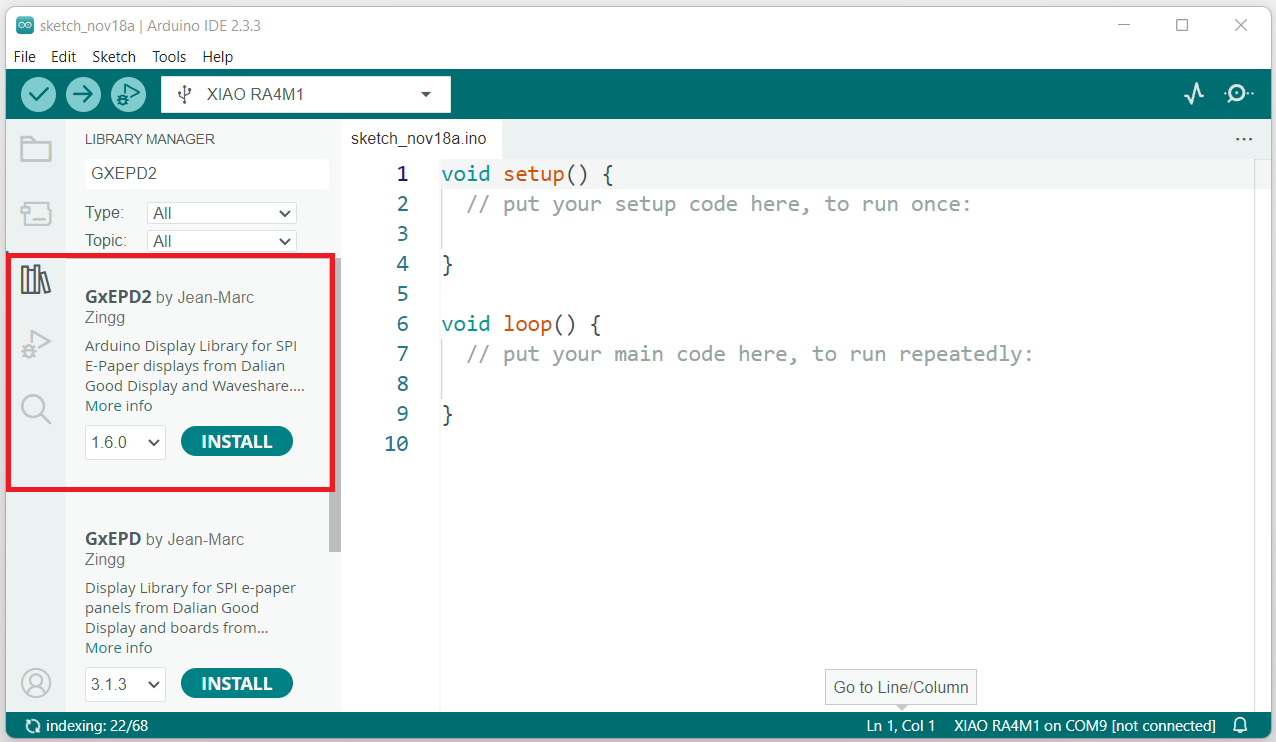 Fig. 1. Installation of GxEPD2
After clicking INSTALL, the IDE will detect dependencies with other libraries (such as Adafruit_GFX) and will ask if you also want to install them. Confirm by clicking INSTALL ALL
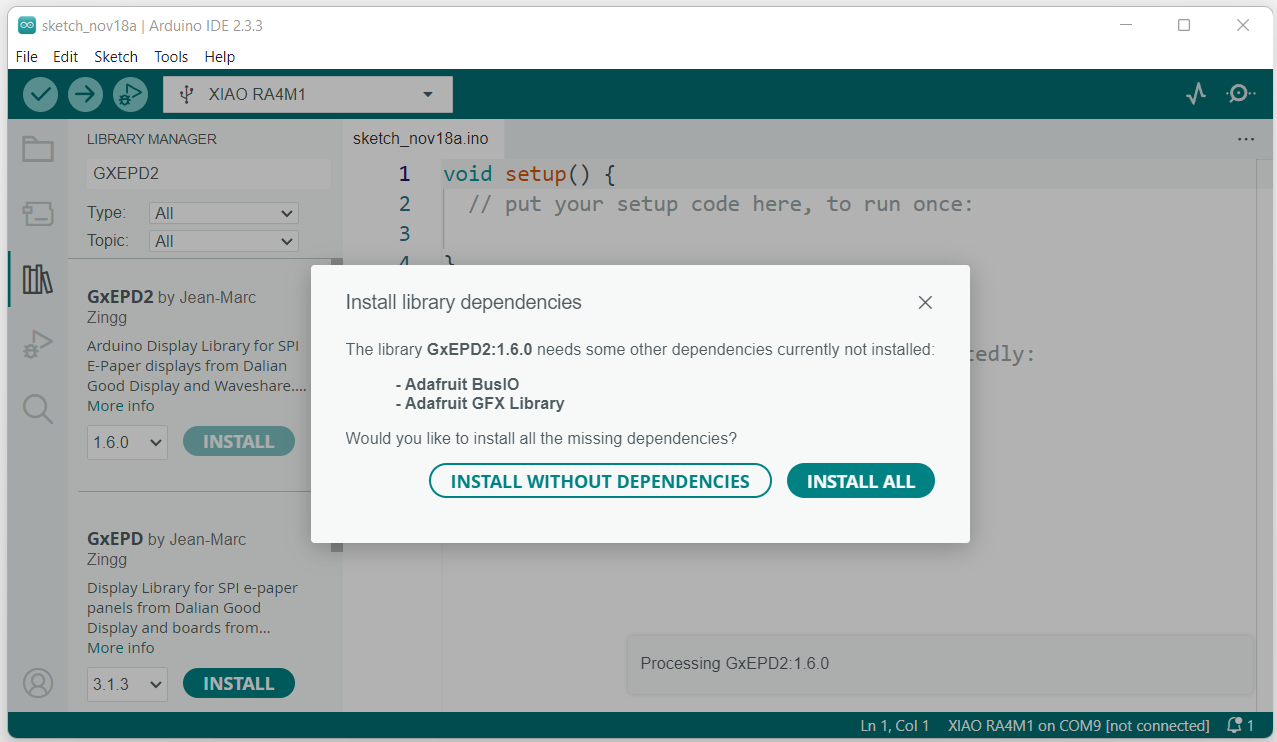 Fig. 2. Dependencies og GxEPD2
After a few moments, the IDE will download and install all the necessary files.
Connections
One of the first steps when working with the GxEPD2 library is configuring the ePaper connections, specifying which microcontroller pins are assigned to the various control signals. In this case, we need to define the BUSY, RST (Reset), DC (Data/Command), CS (Chip Select), SCK (Serial Clock), and MOSI (Master Out, Slave In) signals.
Fortunately, Elecrow has shared the schematic for this panel in their repository, making it easy to inspect and identify the pins on the ESP32 connected to these signals.
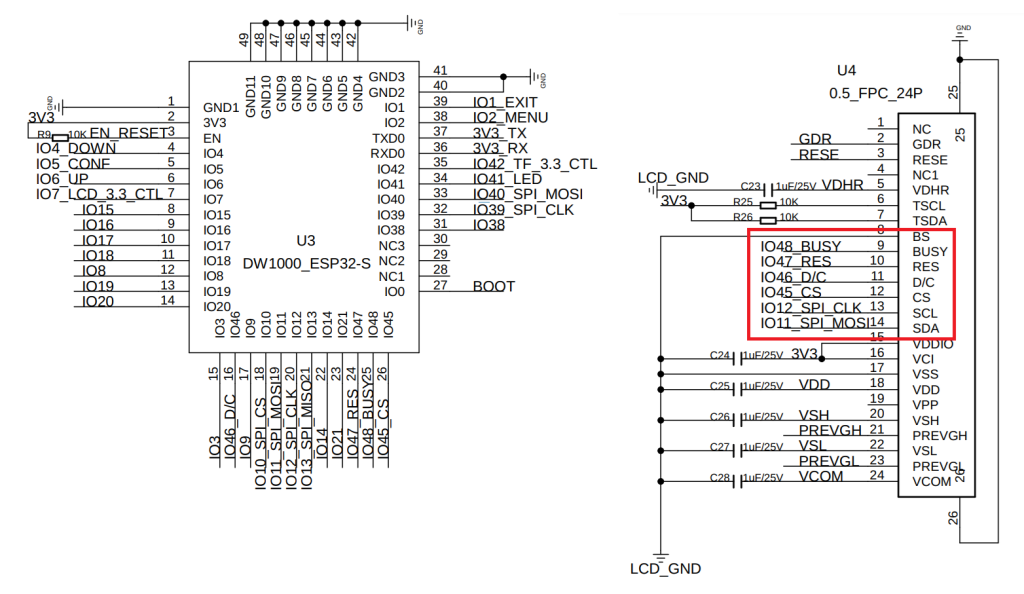 Fig. 3. Circuit of 5.79" panel (fragment)
The connections we are interested in are the ones marked in red in the previous image:
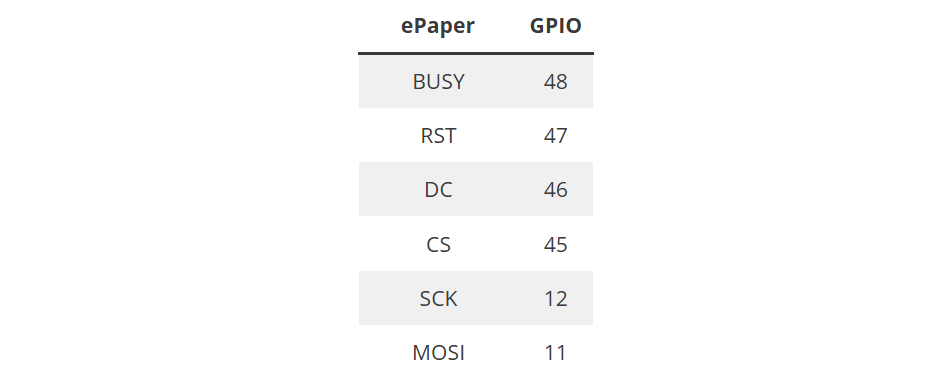
With all the libraries installed and the ePaper connection details ready, we are set to start writing our code using the various features offered by GxEPD. To make it more engaging, we’ll work toward a concrete goal: developing a specific application that makes full use of this panel.
Real-Time Bitcoin Monitor
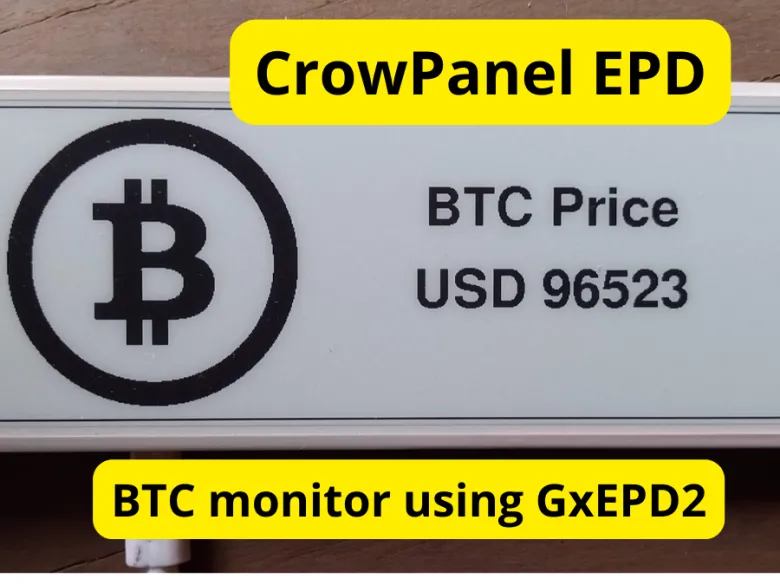
Next, we’ll explore several GxEPD2 functions that enable us to control the ePaper display. Our goal is to build a real-time Bitcoin price monitor. This device will fetch the current value of the cryptocurrency from an online service and display it on the screen. We’ll include images, text, and numbers to present key information in an attractive and visually organized manner.
The final result will look something like this:
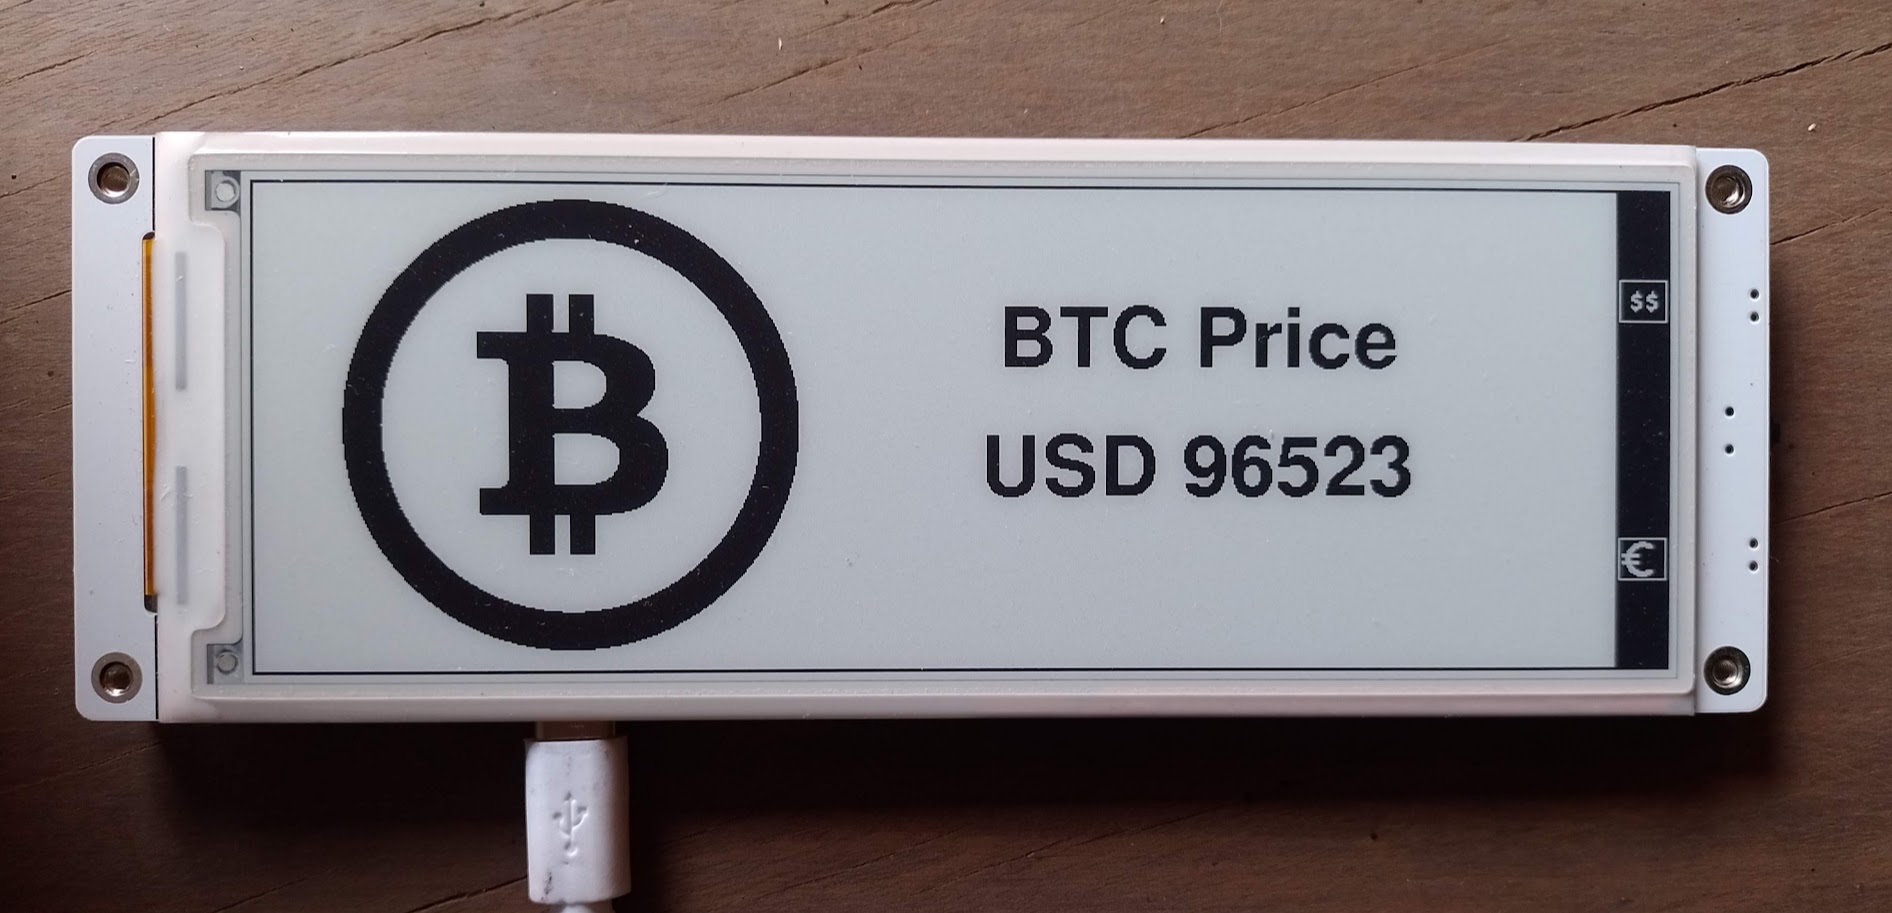 Fig. 4. The monitor in action
To develop the code for this application, we’ll learn how to control each element individually. We’ll break down and analyze each step, so let’s start with the basics.
Displaying Text
Let’s begin with something simple: displaying text on the screen. This will not only help us get familiar with the text-related functions but also teach us how to properly initialize the panel and libraries.
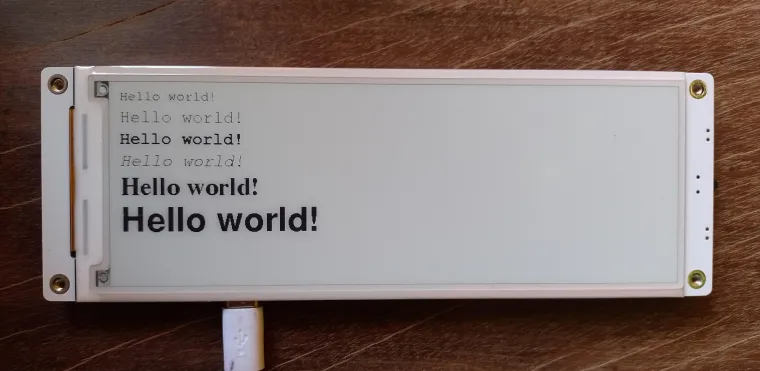
Below is an example that displays the classic "Hello, World!" message using different fonts and text sizes. Let's analyze the code step by step.
In the first lines of the code, we find several #include directives. The first one incorporates the GxEPD2 library, specifically the version designed for monochrome displays (hence the addition of BW). The following #include directives are used to load the font definitions that we will use later to display text on the screen.
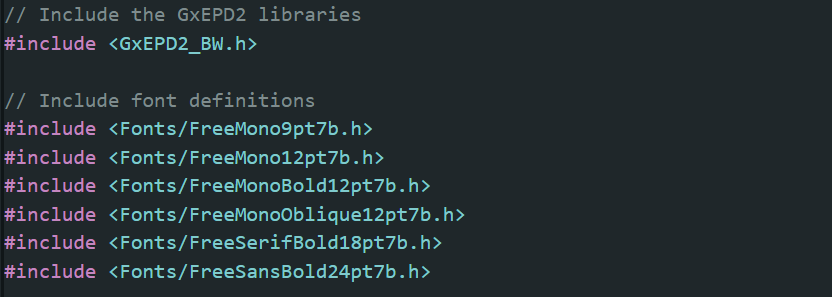
The available fonts are defined in the Adafruit_GFX library, located in the Fonts folder. Each font is defined using a header file (.h).
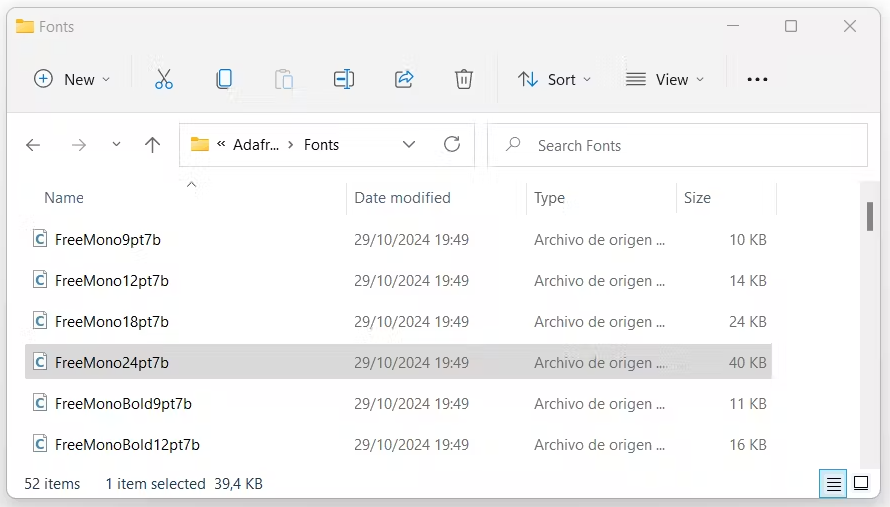 Fig. 6. Font definitions
The name of each font indicates the typeface, style, and size. For example, the font FreeSans24pt7b used in the previous example can be broken down into the following elements:
- Free: Indicates it is a free font, without licensing restrictions.
- Sans: Refers to a modern style font, like Arial. It can also be Mono, a simple monospaced font, or Serif, a more decorative font like Times New Roman.
- Bold: Means the font is bold. It could also be Oblique (italic) or regular if nothing is specified.
- 24pt: Refers to the font size in points.
- 7b: Indicates that the font is defined using 7-bit values.
To select the font for displaying text, you must use the setFont method, but first, you need to load the font definition by including the corresponding header file.
Continuing with the code analysis, we find the definition of several constants that specify the ePaper connections, as mentioned earlier. These values are essential and will be used later to create the object representing the display.

The next step is to create an object associated with the display. To do this, we use a template called GxEPD2_BW, which takes the following parameters:
GxEPD2_579_GDEY0579T93: The class identifier that acts as the specific driver for this display model.GxEPD2_579_GDEY0579T93::HEIGHT: A constant that defines the height of the display and also determines whether paged or non-paged mode will be used (don’t worry, I’ll explain what this means later).
The 5.79″ CrowPanel (like other models) is not listed among the displays supported by GxEPD2 because it is a device that integrates several components in addition to the ePaper display. Based on my tests, the included display’s characteristics match the GDEY0579T93 model from Good Display, which is the one used in the code for this example.
Finally, a constructor is used for the display object (you can rename it if you prefer), passing the display identifier again as a parameter along with the details of the connection pins (using the constants we defined earlier).

Another unique feature of the CrowPanel is that it includes a circuit to control the screen's power, allowing efficient energy management.
The control pin for this circuit is GPIO7, so before attempting to access the display, the first step is to power it on by setting this pin to HIGH.
To achieve this, I’ve included the displayPowerOn function, which handles this task:

Continuing with the code, we move on to the setup function in Arduino.
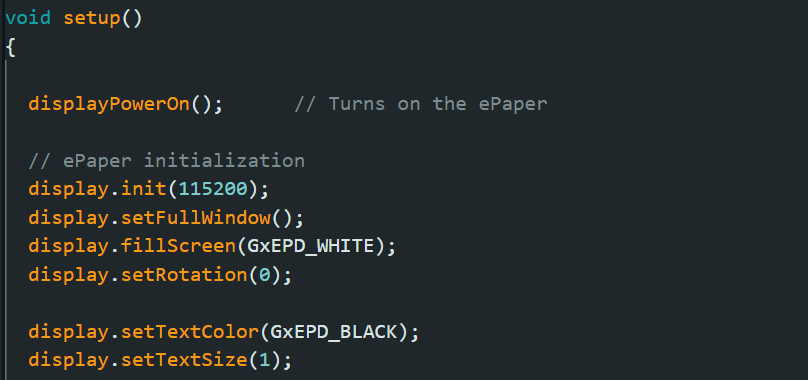
As you can see, it consists of calls to various methods belonging to the display object, which is why the syntax display.method(parameters) is used. Let’s review what each method does:
init: Initializes several elements of thedisplayobject. Here, we provide the value115200, which sets the baud rate for diagnostic output via the serial monitor. You can disable this by setting it to0, but it’s helpful for understanding what the library is doing.setFullWindow: Indicates that the entire screen will be used. It’s also possible to use only a portion of the screen to speed up the refresh process (this is called partial refresh, which we’ll discuss later).fillScreen: Fills the screen with a color, in this case, white (GxEPD_WHITE), clearing any previous content. You can use any of the supported colors:- Black (
GxEPD_BLACK) - White (
GxEPD_WHITE) setRotation: Defines the screen’s orientation in multiples of 90 degrees.setTextColor: Sets the text color.setTextSize: Sets the size of the text.
Finally, there are several blocks that display text using different fonts: setFont Specifies the font or typeface to be used, setCursor positions the cursor at the desired location (the origin, (0,0), is at the top-left corner) and print outputs the text to the screen.
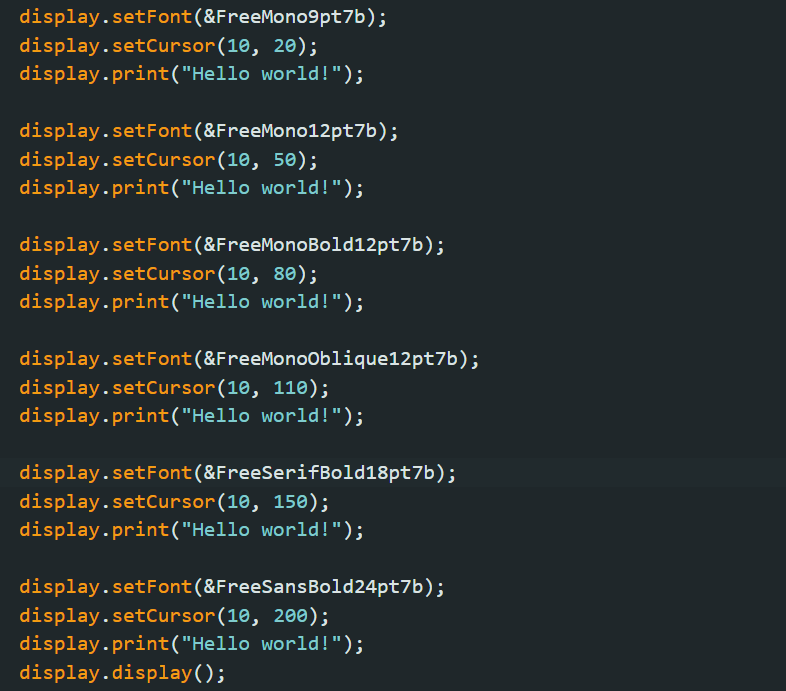
Actually, the methods mentioned above do not directly display anything on the screen. Instead, all the instructions act on a buffer or memory area, which must then be transferred to the screen to make it visible. One way to achieve this is by using the display method, though we’ll explore another method later.
This process of transferring the buffer's contents to the screen is also known as a refresh.
Here’s how the code looks in action:
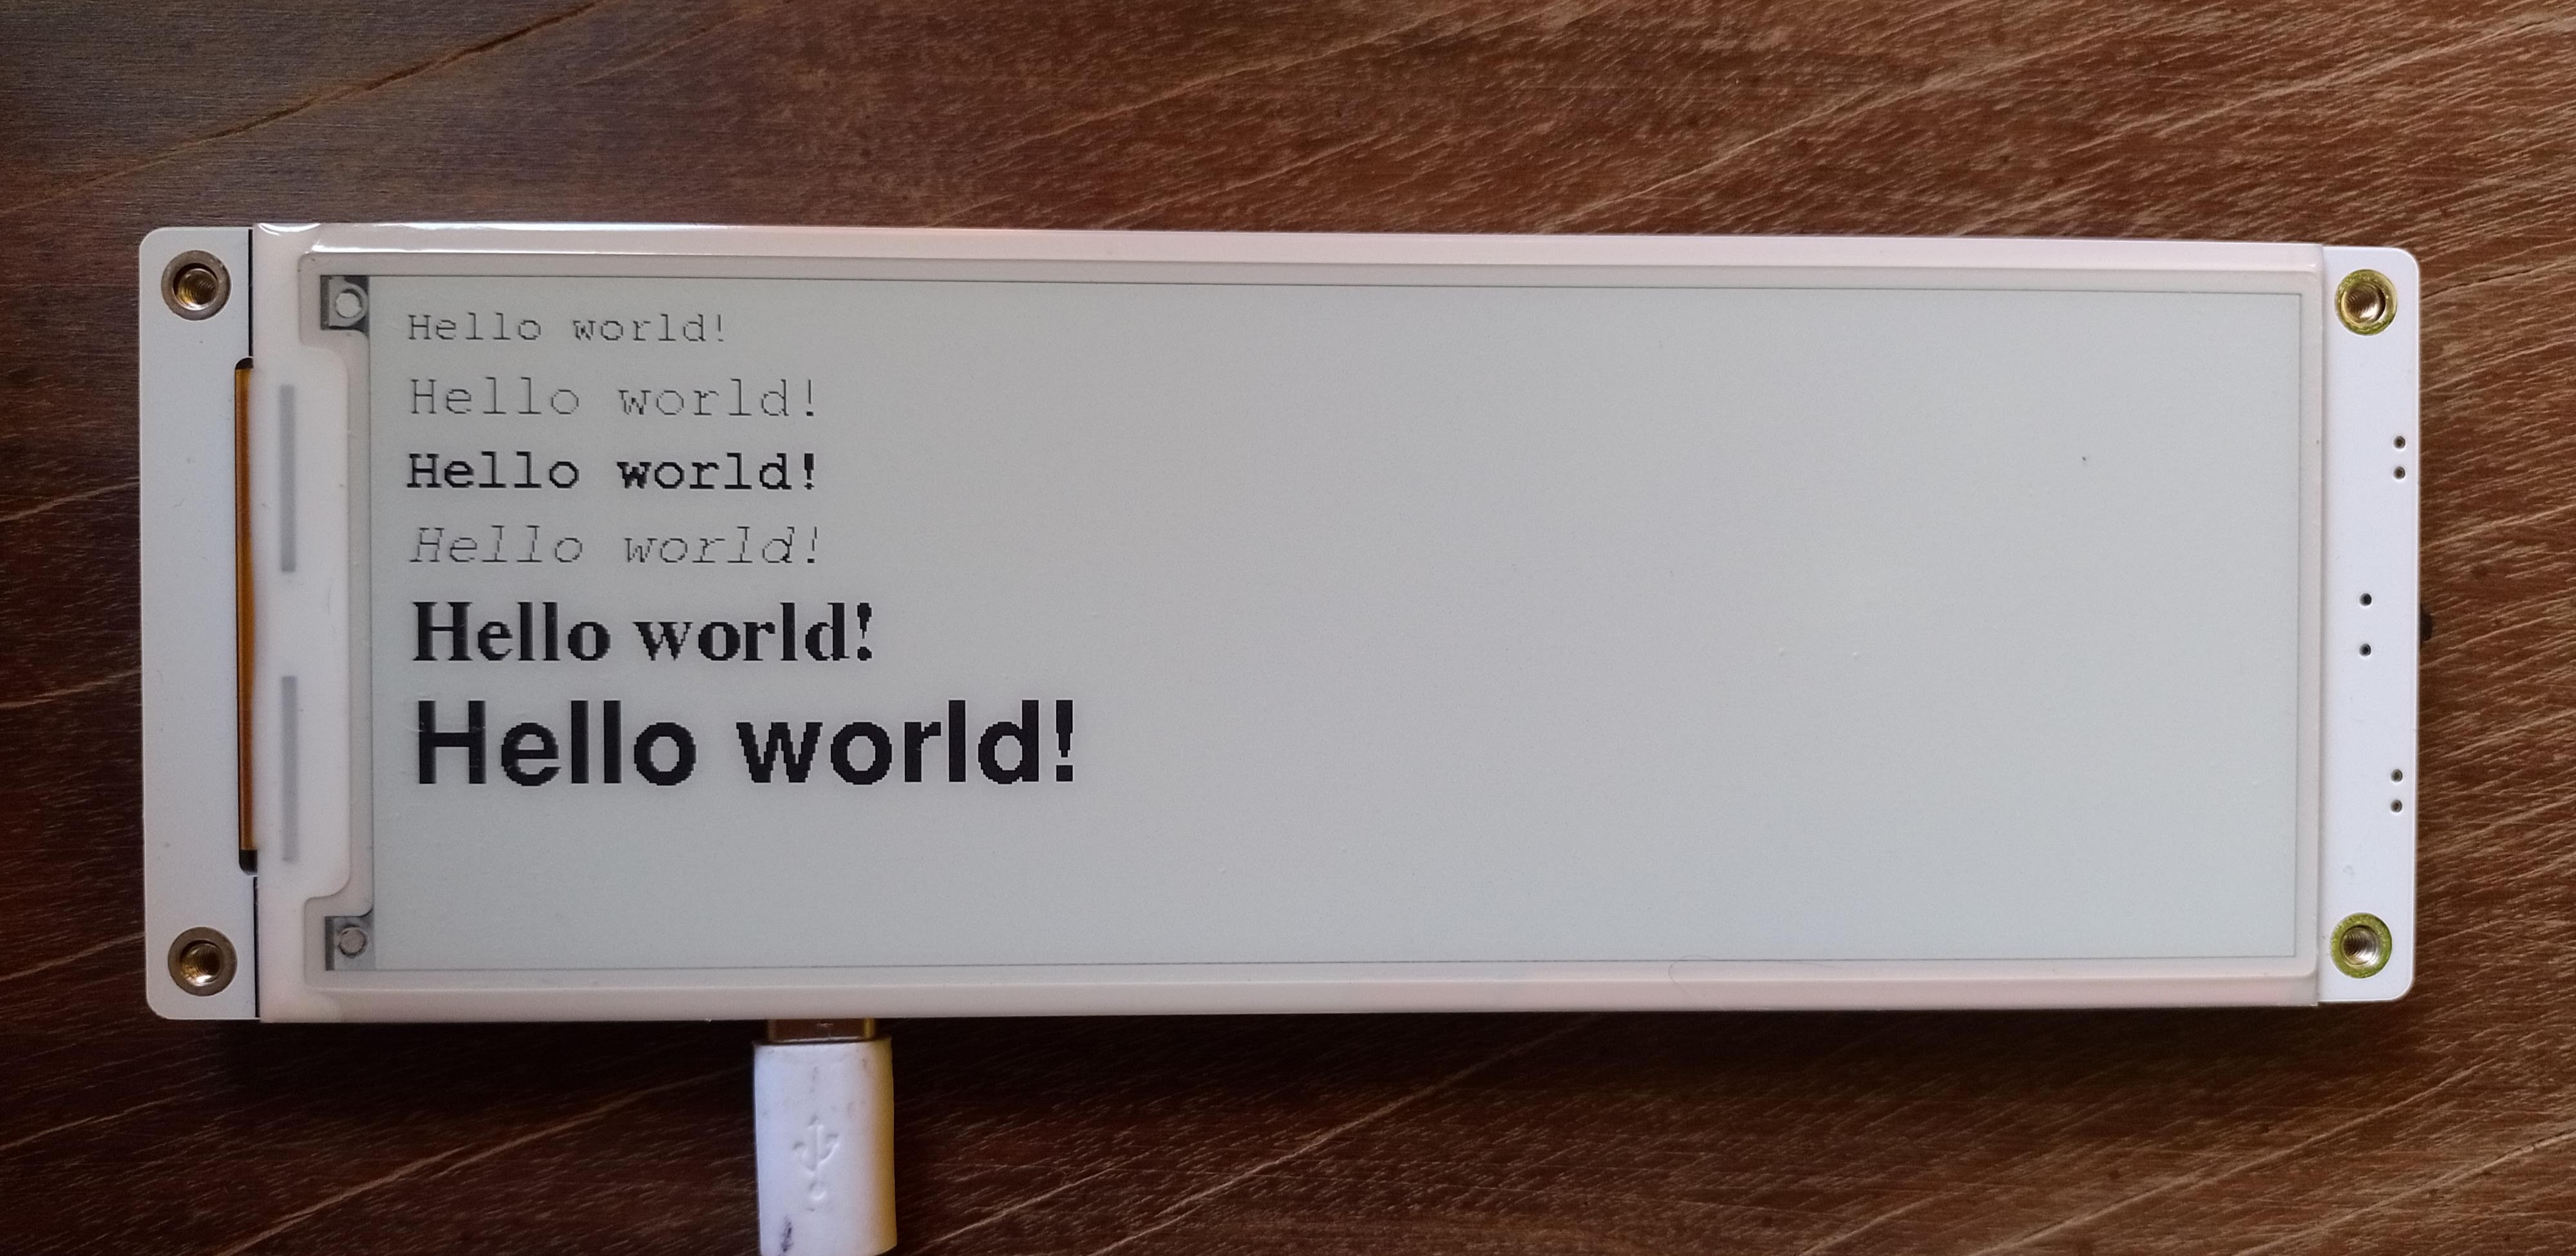 Fig. 7. Text using different fonts
Graphics
The GxEPD2 library also includes methods to draw graphical elements such as points and lines, as well as geometric shapes like rectangles, circles, and triangles, both hollow and filled.
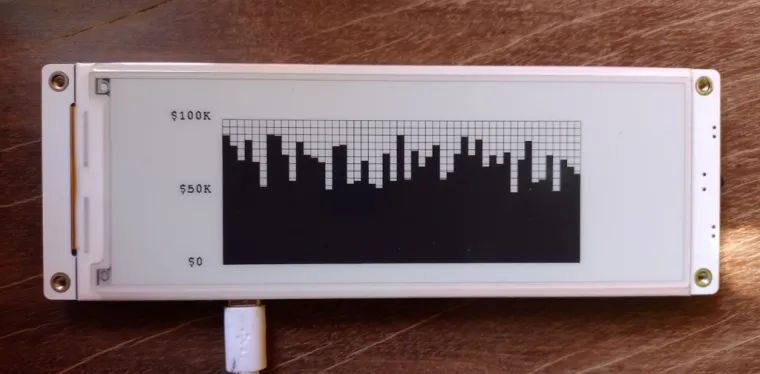
In the following example, I use some of these methods to display a bar chart. You can see the code here.
As you can see, the first part is very similar to the "Hello World!" example. Here, we also include the necessary libraries, define the pins, and create the display object. The initialization of the display at the start of the setup function is also quite similar.
Next, we have the section that draws the bar chart. For this, I repeatedly use two methods for drawing lines and rectangles:
drawLine(x0, y0, x1, y1, color): Draws a line from point(x0, y0)to(x1, y1)in the specified color.drawRect(x, y, w, h, color): Draws a rectangle starting at the top-left corner(x, y), with a width ofwpixels and a height ofhpixels, in the specified color. Note that the origin of the rectangle is its top-left corner, and it is drawn "downward."fillRect(x, y, w, h, color): Similar todrawRect, but the rectangle is filled with the specified color.
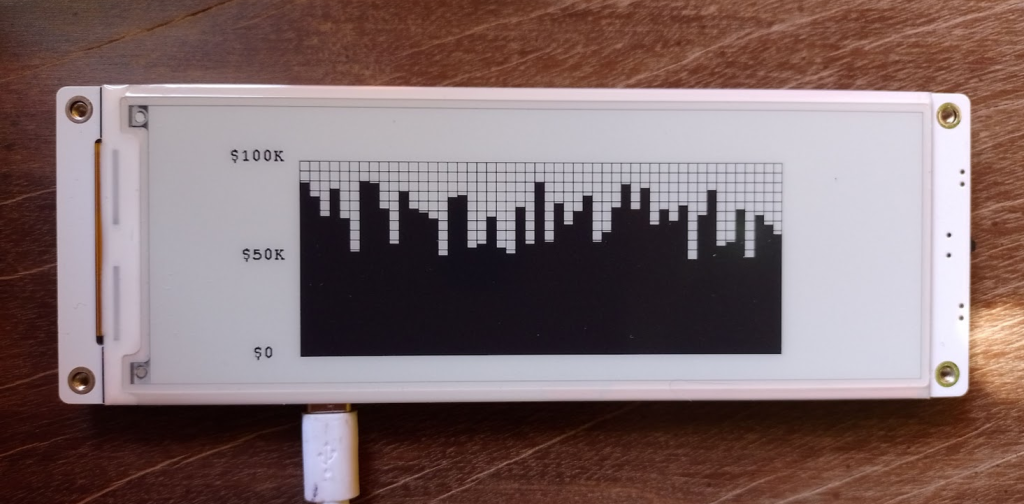 Fig. 8. Example of graphics usage
Specifically, this example creates a canvas of 500 pixels wide and 200 pixels high, which is then subdivided using horizontal and vertical lines. Labels on the left side indicate different values. Since the canvas is divided horizontally into 50 parts, an array containing 50 random values is defined and displayed as black bars.
Images
If the graphical elements mentioned above are not enough and you want to display bitmap images, don’t worry—GxEPD2 supports this as well. Moreover, the image doesn’t need to occupy the entire screen; you can display bitmaps of any size and place them at any position.
The process is the same as I explained in a previous article: First, take the image (which must be monochromatic) and convert it to a header file (.h) using the image2lcd program. Then, include that file in your code with an #include directive and place it on the screen using the drawBitmap method.
The syntax for drawBitmap is as follows:
drawBitmap (x, y, bitmap, w, h, color);Where:
x, y: The starting coordinates of the bitmap (top-left corner).bitmap: The identifier of the image (defined in the.hfile).w, h: The width and height of the bitmap in pixels.color: The "foreground" color to differentiate it from the screen background.
The only precaution you need to take is to horizontally mirror the image before converting it with image2lcd.
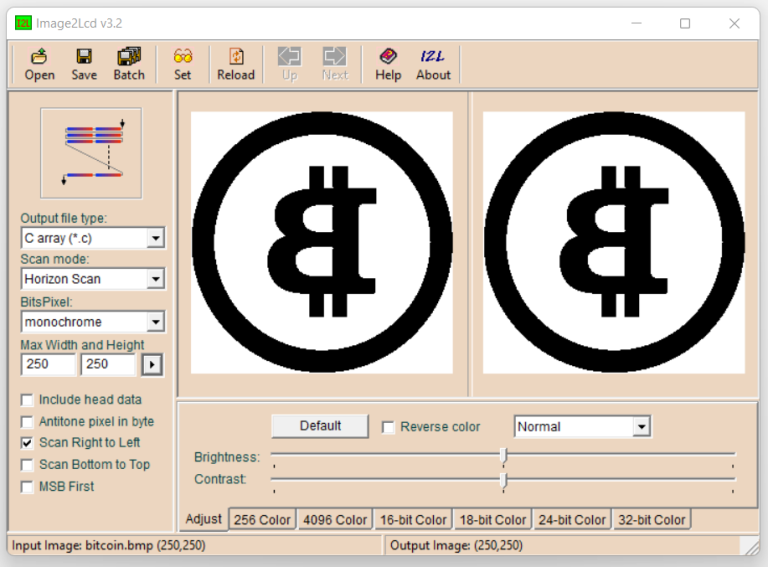 Fig. 9. Mirrored image
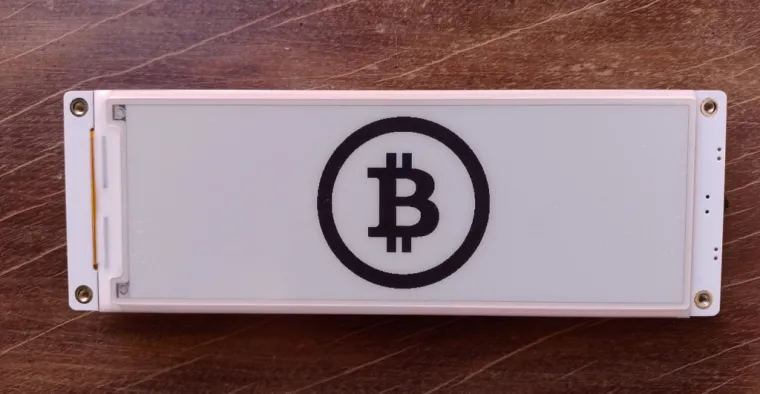
In the following example, I’ll show you how to load a bitmap (the Bitcoin symbol in this case) and display it in the center of the screen. See the code here.
After running the code above, the following image is displayed:
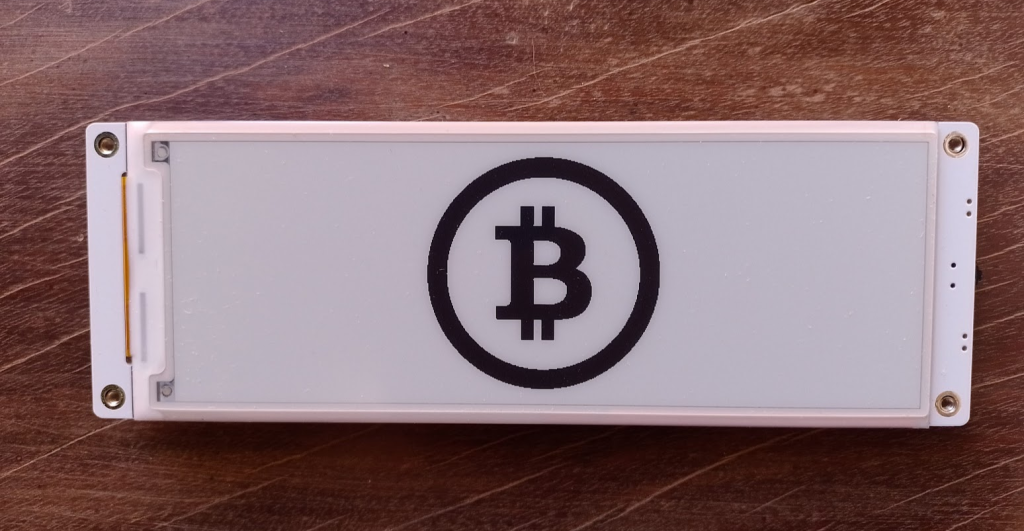 Fig. 10. Bitmap usage example
Partial Refresh
In the previous examples, we used different methods to display text, graphics, and images. In each case, the entire screen was updated using the display() method, which renders the results of the operations on the screen. Additionally, in all examples, we initialized the screen with setFullWindow(). This ensures that display() redraws the entire screen, performing what is known as a full refresh.
Updating the entire screen is a relatively slow process. While this isn’t usually an issue when done once at the start of the program, it becomes inconvenient when a value needs to be updated frequently, such as with a temperature sensor that refreshes every two seconds. In such cases, the delay becomes unacceptable.
Fortunately, the 5.79″ CrowPanel supports a feature called partial refresh, which allows updating only a specific portion of the screen without redrawing all the pixels. This is not only significantly faster but also eliminates the flickering associated with a full refresh. Thanks to partial refresh, it’s possible to display dynamic values on the ePaper that update more quickly.
The following video demonstrates a comparison between the two refresh techniques. It displays the value of a counter from 1 to 10, first using full refresh and then partial refresh. The difference is remarkable.
You can find the code for the video example here.
In this example, I’ve structured the methods slightly differently, using what is called paged mode in GxEPD.
Paged mode is designed for microcontrollers with limited RAM (such as an Arduino UNO). Instead of storing a buffer for the entire screen in memory, only a fraction of the screen (e.g., half) is stored. The refresh is then performed in two steps: first, the content for one half of the screen is generated in the buffer and transferred, and then the same buffer is reused to prepare and transfer the second half. While this approach is slower than refreshing the entire screen at once, it significantly reduces memory usage.
To use paged mode, you first need to specify that the buffer represents only a fraction of the full screen. This is done when creating the display object. For example, to use half of the screen, you can set the buffer size to HEIGHT/2.
Next, the methods for accessing the screen must follow this structure:
- Start the pagination cycle using the
firstPagemethod. - Enclose the methods that modify the screen within a
do..whileloop. - Repeat the loop while the
nextPagemethod returnstrue, indicating that there is still data left to transfer to the screen.
Returning to the example, although I’ll define the buffer to cover the full screen (as the ESP32-S3 on this panel has sufficient memory), I will organize the code in the style of paged mode.
As you can see, the key difference is that in the first part, the screen is initialized with setFullWindow(), while later it is done with setPartialWindow().
The setPartialWindow() method defines a "window" within the screen that will be modified and updated, leaving the rest of the screen unchanged.
The syntax of this method is:
setPartialWindow (x, y, w, h);
Where:
x, y: Starting coordinates of the partial refresh window.w, h: Width and height of the window.
Interface Buttons
All CrowPanel models include a set of buttons on the side to enable user interaction. These consist of two buttons and a rotary switch connected to the ESP32-S3, whose state can be read directly from your program.
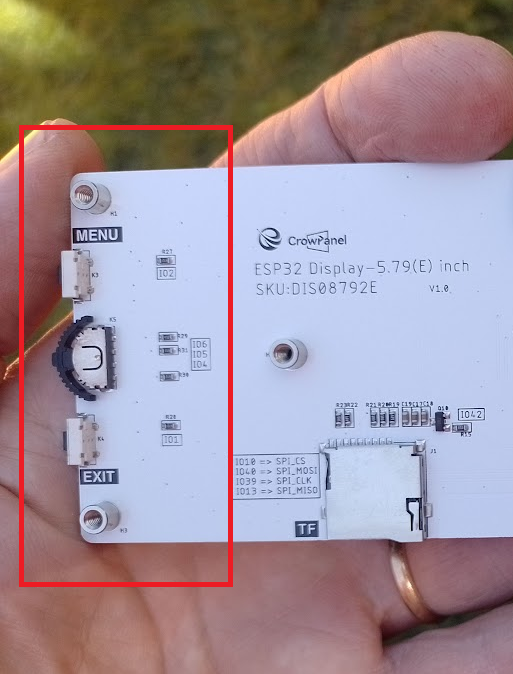 Fig. 11. User buttons
The connection pins can be seen in the schematic:
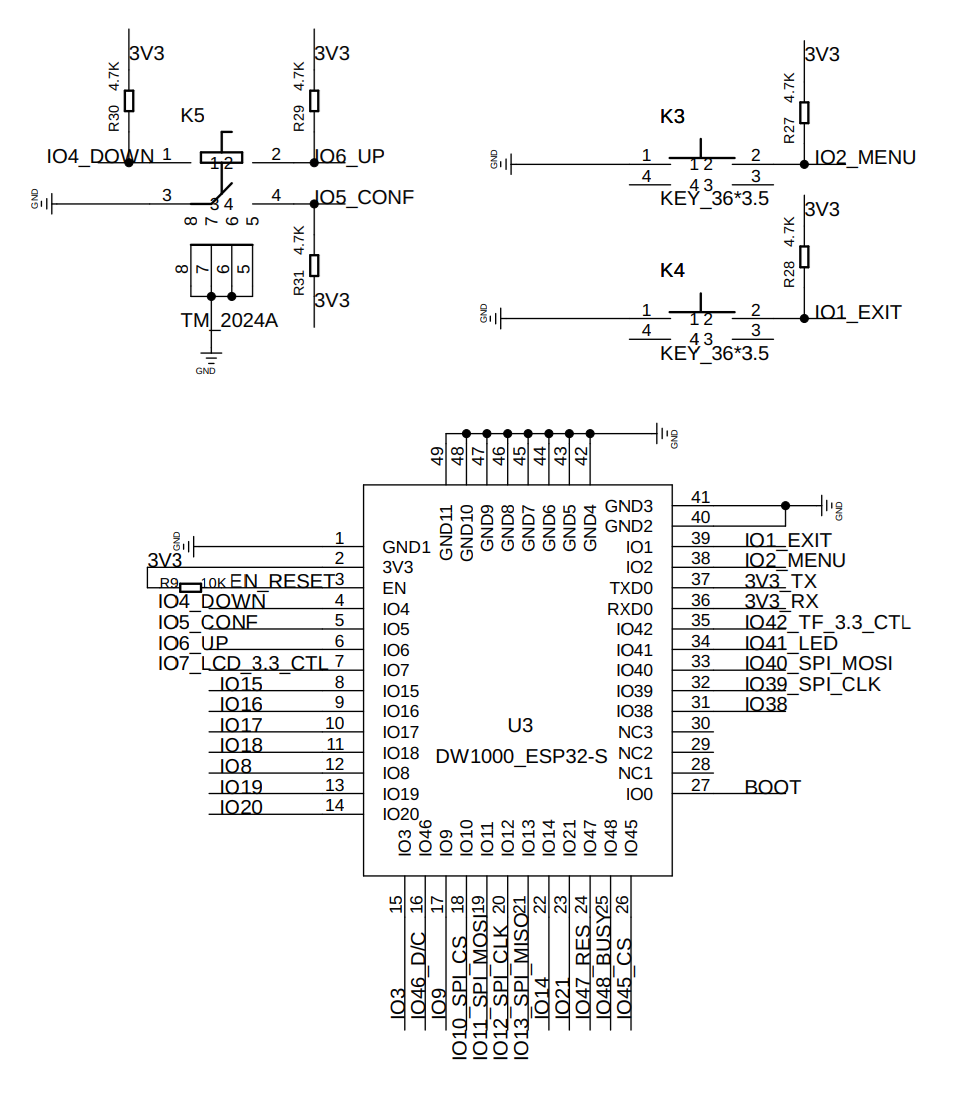
Fig. 12. Buttons connections
This means that MENU is connected to GPIO2, EXIT to GPIO1, the rotary switch for up to GPIO6, for down to GPIO4, and pressing the rotary switch activates GPIO5. Each input has a PULL_UP resistor, so they are activated when pulled LOW.
Putting It All Together
Let’s bring everything we’ve learned into a practical application: a Bitcoinprice monitor. This monitor will fetch the real-time price of Bitcoin from CoinGecko, a site with a very simple API. The API allows us to make GET requests without the need for registration or an API key.
We will make a request every 30 seconds (it’s important not to make requests too frequently, as the site might return a value of 0). The retrieved value will be displayed on the panel using partial refresh. Additionally, we will implement button controls: pressing MENU will show the price in US dollars (USD), and pressing EXIT will display it in euros (EUR).
The endpoint used for the requests is as follows:
https://api.coingecko.com/api/v3/simple/price?ids=bitcoin&vs_currencies=usd,eurAnd the values are returned in JSON format:
{"bitcoin":{"usd":101971,"eur":98173}}To extract the different fields (commonly referred to as "parsing the JSON"), we will use the ArduinoJson library.
Here’s how the Bitcoin monitor looks in action, you can find the complete code listing at the end of the article.
Repositories
The code and images used in this project can be found in this repository. The rest of the examples are available in this other repository.
Conclusions
In this article, we explored the advanced capabilities of the 5.79-inch CrowPanel by using the GxEPD2 library, a versatile and widely adopted tool for controlling ePaper displays. From the initial setup to integrating features like text rendering, graphics, and partial refresh, we successfully built a Bitcoin monitor that blends design with functionality.
Throughout the process, we learned to:
- Install and configure essential libraries like GxEPD2 and Adafruit_GFX in the Arduino IDE environment.
- Define the physical connections for the ePaper panel using the schematics provided by Elecrow.
- Use advanced techniques such as partial refresh to optimize ePaper display performance, reducing refresh time and eliminating unnecessary flickering.
- Incorporate physical controls, such as the CrowPanel buttons, to provide an interactive user interface.
- Implement a real-time Bitcoin monitor by leveraging the CoinGecko API to fetch live price updates in USD and EUR.
Building this monitor not only demonstrates the capabilities of the CrowPanel and the GxEPD2 library but also provides a practical approach to developing dynamic applications for microcontrollers, particularly in data visualization.
While this example focused on a Bitcoin monitor, the tools and concepts presented are applicable to a wide range of projects using ePaper displays, from environmental monitors to informational panels. With the examples available in the GitHub repository, you can customize and extend this project to suit your specific needs.
As always, I hope you found this content helpful. If you’d like to support my work, you can make a donation on my Patreon profile. If you have any questions or suggestions, feel free to leave them below in the comments section. See you next time!
For more information and projects, you can check out my blog and social media.


